In response to the Corona Virus epidemic the US government passed a two trillion dollar economic relief package, known as the CARES act to pump money into the economy and give dollars directly to the American people. One facet of the CARES act was the Paycheck Protection Program(PPP). The PPP was set up to help small businesses keep their workers on the payroll.
PPP loans were sent out to help people, but what is the issue? PPP loan applications did not require demographic reporting. In New York alone, there are over 800 thousand unanswered demographic responses (82% of all records). This makes it hard for us, as Americans, to know exactly where the help went and what communities it helped (even though these are our tax dollars at work).
To try and get a better idea of where the loans went in New York State, I merged the PPP loan data on zip code level demographics in New York State. PPP data sets are split up into two major buckets: the first is loan data across the whole country for loans over 150 thousand dollars, as well as state level data for all loans under 150 thousand dollars. For this exploration I split up the two data sets by 'Majority White Zips' (zip codes where the white population exceed 50%) and 'Majority Non-White Zips' (zip codes where the white population is less than 50%), gleaned from the census data. The hypothesis was that white zip codes would get more loans, and they per capita, would be getting more help in majority white zip codes.
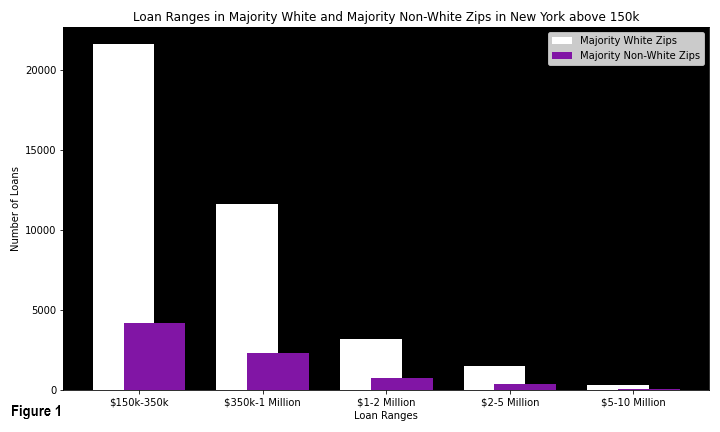
The first data set (of PPP loans over 150 thousand), separated the data in buckets of loan ranges, instead of specific loan amounts for each loan. When we add that to the census' demographic data(Figure 1) we can see that majority white zip codes received many, many more loans than majority non-white zips.
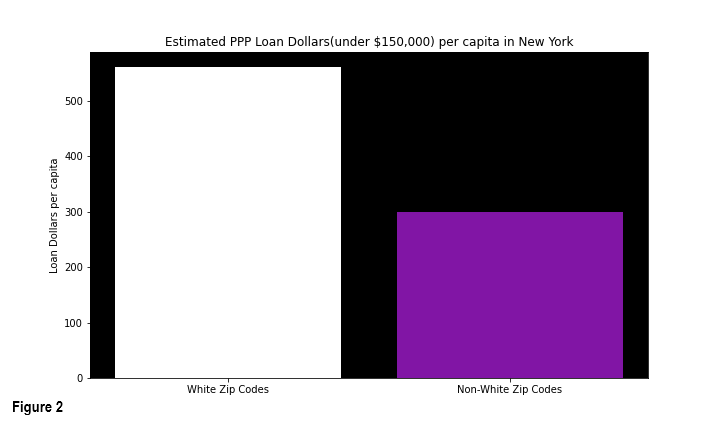
 The second data set (of PPP loans under 150 thousand) provided specific loan amounts for each loan that was given out in New York, with that, we can more specifically show how many loan dollars went to each zip. Knowing how much went to each zip we can see per capita the loan dollars that went to each zip code (Figure 2). Majority white zip codes got on average $559.71 per person in loan assistance, while majority non-white zip codes were only afforded $299.92 per person in loan assistance.
The PPP was created to help all Americans and because we don't have significant demographic data from the PPP it is hard to see where loans went. We see what the PPP cannot show, that there was a failure in the PPP and loan dollars were not properly distributed. Lack of data transparency hides this obvious disparity, preventing impactful and targeted assistance. The Small Business Administration (SBA) has recognized the importance of demographic data and in response said:
"PPP loan data reflects the information submitted by lenders to the SBA for PPP loans. Approximately 75% of all PPP loans did not include any demographic information at the time of loan application. The loan forgiveness application expressly requests demographic information for borrowers so that SBA can better understand which small businesses are benefiting from PPP loans." ( SBA, Paycheck Protection Program (PPP) Loan Data – Key Aspects – Updated August 20, 2020)
Here is the notebook used to clean and analyze the data for this project: