In an effort to increase transparency of the NYPD, ProPublica dropped data from the Civilian Complaint Review Board (CCRB). The ensuing data set included allegations against more than 3000 New York City Police Department officers, and whether the CCRB substantiated the claims. Every officer in the data set had at least one substantiated claim against them. So using this data, I attempted to model if the claims would be substantiated.
Before modeling began, I knew it would be important to clean the data and engineer some features. As a classification problem, I had to feature the target matrix because the original target (board_disposition)) had 3 possible values (substantiated, unsubstantiated, and exonerated). The new target matrix (substantiated) was a Boolean of if the complaint claim was simply substantiated or not, making a binary classification.
Another feature I thought would help the model is the length of the review (review_length_mo), which because they give us year and month for when the complaints were opened and closed, was very easy to engineer.
Since every officer in the data set has at least one substantiated claim, maybe having more complaints leveed against would also lead to a substantiated claim. After counting all the times each unique member of service id (unique_mos_id), showed up in the data I separated the data into its own data frame, and added the lots_of_allegations feature, meaning the officer had more than ten claims against them (‘ten’ was an arbitrary number for ‘lots of allegations’, but I am pretty sure a lot of companies would fire an employee well before the tenth claim of harassment from customers). Now that we had the unique_mos_id mapped to the Boolean for lots_of_allegations I could merge this against the main data frame.
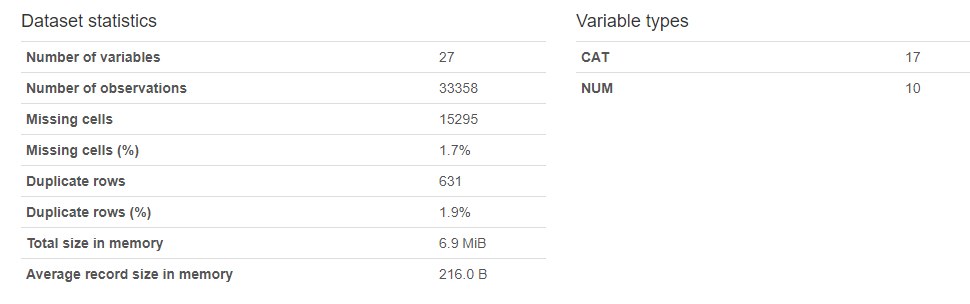
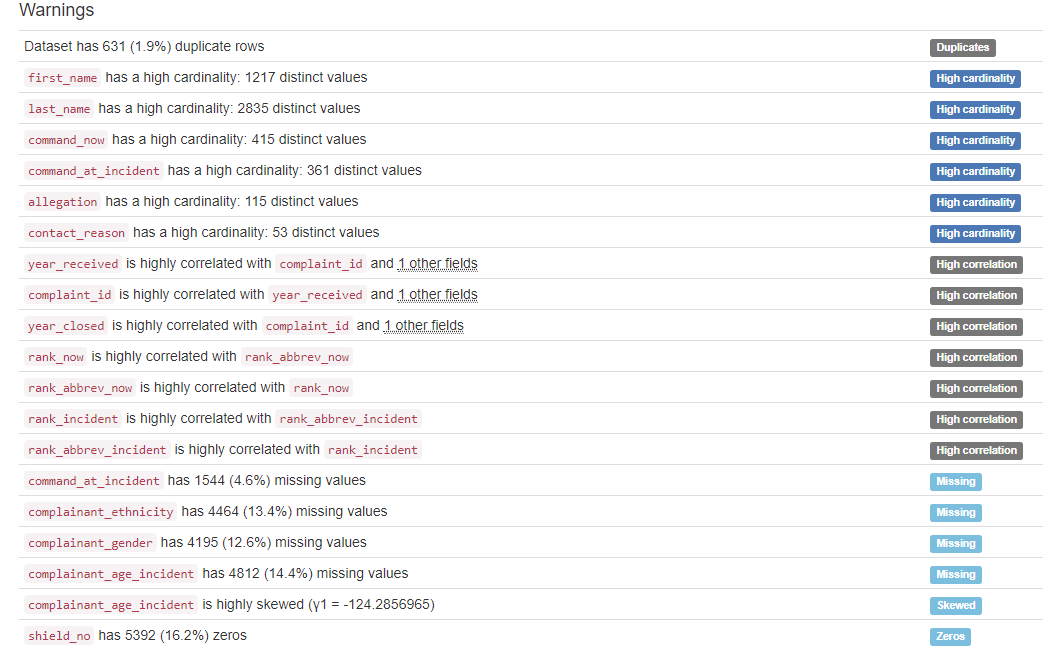
To reduce leakage, I used pandas_profiling (shown below) to identify some high cardinality columns as well as unique identifiers for each complaint/officer. Since names shouldn’t inherently have an effect on whether the claims were substantiated, all columns with officer names were dropped. Other dropped columns included anything that wouldn’t have a result on the substantiated claim, or were too high cardinality for the model. The “allegations” feature was not dropped, though it was high cardinality, as it is a key determinate of a complaint.
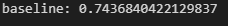
Now we can get to the fun part, modeling! Firstly I did a baseline classification of the majority class (unsubstantiated(0)), around .74 accuracy score. Because there are so few substantiated claims (the CCRB feels that in many cases they aren’t able to reach conclusions because the NYPD doesn’t provide crucial evidence) most of the time we can simply guess that the claims were not substantiated. I thought I could do better!
Next I transformed my data before running it through the model. I used a column transformer to impute categorical data using the ‘most frequent’ strategy, and then the categorical data was ordinal encoded in the transformer. The numerical data was just imputed.
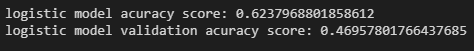
After the transforming, the data was fit to a simple LogisticRegression model, and the model provided an accuracy score about .5 above the baseline.

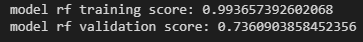
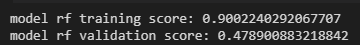
Next I did my random forest model for better performance than a simple LogisticRegression. With no tuning or pruning of my forest, the accuracy score of the model on the test set was .73 (approximately .01 point under my baseline!). I thought I could do better, so I used GridSearchCV to extract the best parameters. Hyperparameters I thought I should tune were: max_depth, n_estimators, min_impurity_decrease, max_features, and min_samples_leaf, to make my model better. After the GridSearch came up with the best parameters for my model, I refit on the data again, but this time my model just met the performance of my baseline.

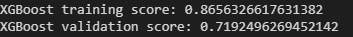
Frustrated, down but not out, I attempted a XGBoost model as well, to see if it would outperform my previous models and give me something to use! Unfortunately I hit snags yet again, and the base XGBoost model’s accuracy was only .72, even WORSE than what I had with my logistic regression. I still thought I could make something happen with this model so I tuned it (best four hours of my life). Hyperparameters tuned for the XGBoost model were: eta, num_parallel_tree, max_delta_step, n_estimators, and max_depth. I used a lot of parameters on my XGBoost because I was getting so frustrated with my lack of models. max_delta_step, specifically was chosen because the documentation says it helps models with heavily weigted majority class. Again I experienced failure, as my models accuracy was .71.

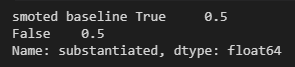
I was unable to build any models that could predict better than the baseline, but I was not done here! Luckily one of my classmates also had a similar issue, where the baseline was better than all models, even the tuned ones. imblearn.over_sampling.smote, would be our savior (Thanks Ashely). SMOTE realigns the data so that the majority class (unsubstantiated) does not totally overpower my minority class (substantiated) Now I was ready to smite (haha) the data. SMOTE does not like categorical variables, but thankfully I had already transformed my data before hand, so dropping that into the module was a piece of cake.
After using SMOTE my baseline was now .5, and I could actually put my models to work. I added all of my transformed data into both the tuned and untuned models and got much better predictions than before.
smote baseline
logistic model accuracy
Random Forest Model Accuracy

XGBoost Model Accuracy
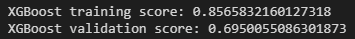

My tuned XGBoost model ended up being my best model with the most accuracy compared to my SMOTE baseline. Below we can see the importance of each feature in the model.
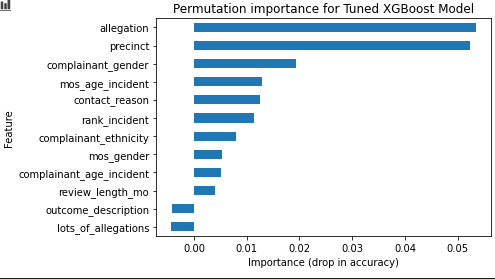
The feature I added (lots_of_allegations) ended up not improving the model. I think because every officer in the data set had at least one substantiated allegation, it didn’t matter to the model if they had more allegations. In the future I think the models can be improved by breaking down variables even further into more features. For example, ‘precinct’ can probably be broken down into location, and location could be broken down into demographic data, all which could have an effect on the model in the future.
Link to Github repository where you can find the notebook and the data: